You get what you measure, so what should you be tracking when in comes to design? Taking a strategic turn can require turning one’s gaze inward even when becoming more customer-centric.
Companies large and small are turning towards design thinking in increasing numbers for a competitive edge. Blurring the line between planning and execution, design thinking with its emphasis on empathy  and experimentation offers an avenue for introducing innovation to all functions and employees in an organization. However, transforming an organization into a design-driven one does not happen without investments. And when it comes to money, sooner or later someone is going to need some hard data on the effects of these investments.
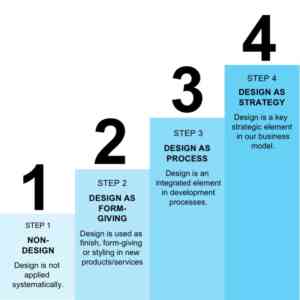
Design Value Index, a portfolio of publicly traded stocks from companies considered to be design-driven, systematically outperform the S&P 500 with more than twice the returns. However, design can be used in different forms and extents in companies. For example, the Design Design Ladder distinguishes between design as form-giving, as an integrated process and as strategy. (If you’d like to know where your own organization stands in terms of design practices, you can start by doing the Design Maturity Survey self-assesment online.)
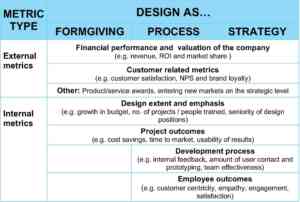
Going through research on impact measurement, we noticed the lack in established design metrics particularly pronounced moving into the more strategic effects of design. Surprisingly, when design starts moving to a more strategic level, internal metrics increase in their weight. Yes, customer satisfaction is still important, but more is needed to track progress within the company. For example, within the past seven or so years, OP Financial Group has come to house one of the biggest design agencies in Finland, employing over 80 designers internally (and many Design Factory alumni, I might add). While initially Net Promoter Scores and tracking the percentage of projects utilizing design was sufficient, once design reaches most realms of the organization, they found themselves wanting something more conductive of development efforts rather than proof-of-case. OP now measures feature turnaround time, internal satisfaction for design projects and innovation maturity across the organization twice a year.

Further data from the Design+ research project suggests that showcasing design improvements and the quality in terms of e.g. awards won helps in making the case for extending design. However, the most convincing arguments seem to come from internal efficiency. Showing that design can speed time to market and cut the required engineering hours for development carries weight, particularly in traditional engineering-driven companies. As Carlgren and fellow scholars highlight, when the honeymoon is over, metrics become important in continuing the transformation towards becoming design-driven.
For more on measuring design, see our conference publication: Björklund, T.A., Hannukainen, P. & Manninen, T. (2018). Measuring the impact of design, service design and design thinking in organizations on different maturity levels. ServDes 2018, Service Design & Innovation Conference.
 Aalto DF